A Closer Look at the Class of 2025
In the survey, 53.8% of respondents self-identified as white, 37.8% identified as Asian, 13.1% identified as being of Hispanic or Latino origin, 4.1% identified as Black or African American, 1.4% identified as Middle Eastern or North African and 0.7% identified as Native Haiwaiian or other Pacific Islander.
However, according to the Office of Institutional Research, 33% of the senior class identifies as white, 19% identifies as Asian, 17% identify as Hispanics of any race, 13% are international students, 11% are Black or African American, 7% identify as two or more races, <1% identify as Native Hawaiian or Other Pacific Islander and <1% are not reported.
OIR data did not list any students identifying as American Indian or Alaska Native. Additionally, no students reported American Indian or Alaska Native as their racial category in our survey.
79.2% of the form respondents identified as cisgender women. 15.3% identified as non-binary and 0.7% identified as transgender men. 4.2% of respondents indicated that form options didn’t define them.
69.7% of respondents said they identified as LGBTQ+.
91.7% of respondents said that they spent four full years at Wellesley.
The most common major was Economics, with nearly 12% of our form respondents. Other common majors were Computer Science, Data Science, and Political Science.
The average GPA of those who responded is 3.71.
7.1% of students said that they had broken Wellesley Honor Code in an academic setting, while 84.4% said that they hadn’t.
Wellesley students are able to take courses at MIT, Babson, Olin, and Brandeis. The most common school seniors cross-registered at was MIT, which 43.8% of respondents took classes at.
79.9% of students participated in research while at Wellesley. The most common form of research participation were independent studies. Students also were research assistants for professors, wrote theses, and participated in other forms of research.
68.1% of respondents said they were satisfied with their financial aid package, while 66.9% said they were not graduating with student loans.
49% of students said they were working a job after graduation. The most common industry was academia at 21.3%.
The two most common states people will be in after graduation are New York and Massachusetts. 9.84% of respondents will be going abroad after graduation.
The most popular Wellesley tradition is Marathon Monday, which 72% of students said was their favorite tradition.
16.8% of students said they were still in contact with their Flower Sunday big, while 77.2% decided to be bigs themselves. Flower Sunday is Wellesley’s oldest tradition.
53.8% of students said they had swum in Lake Waban.
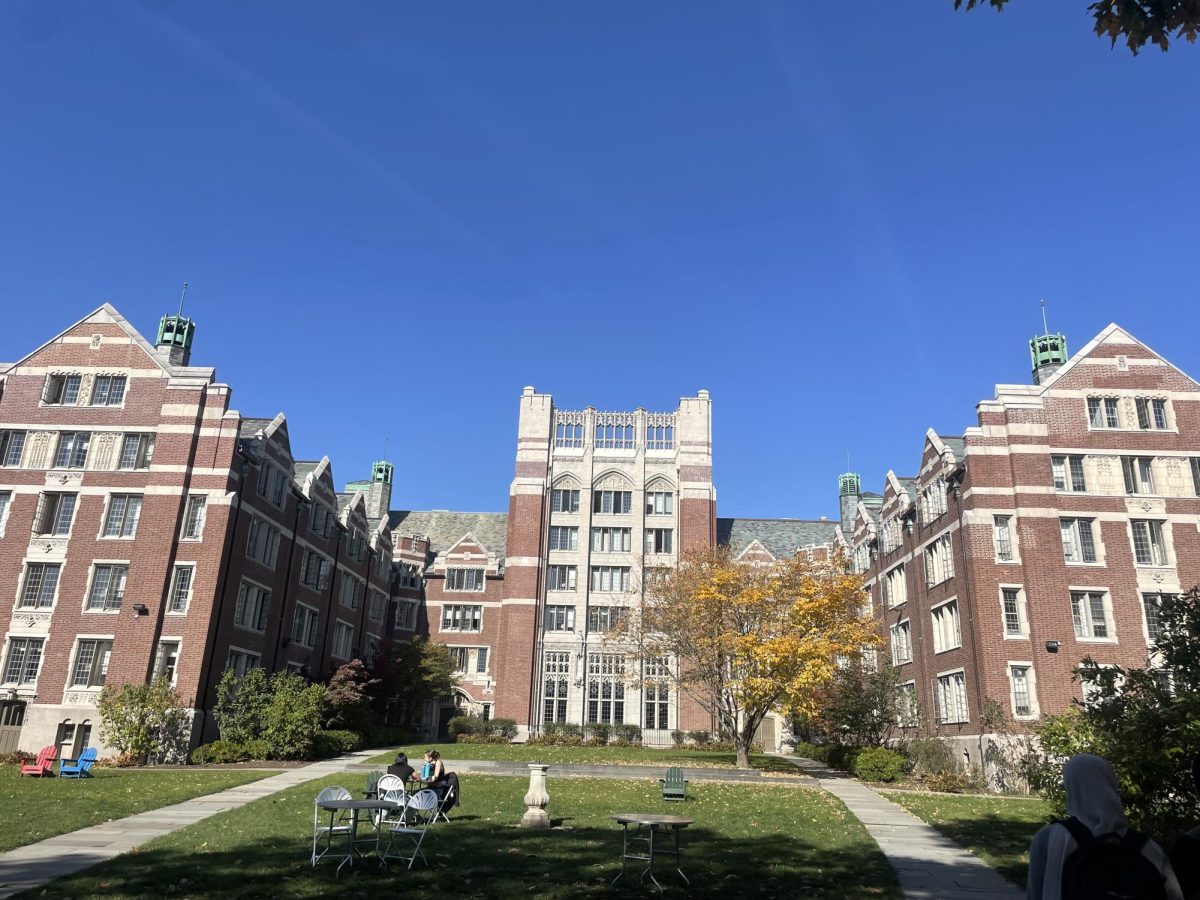
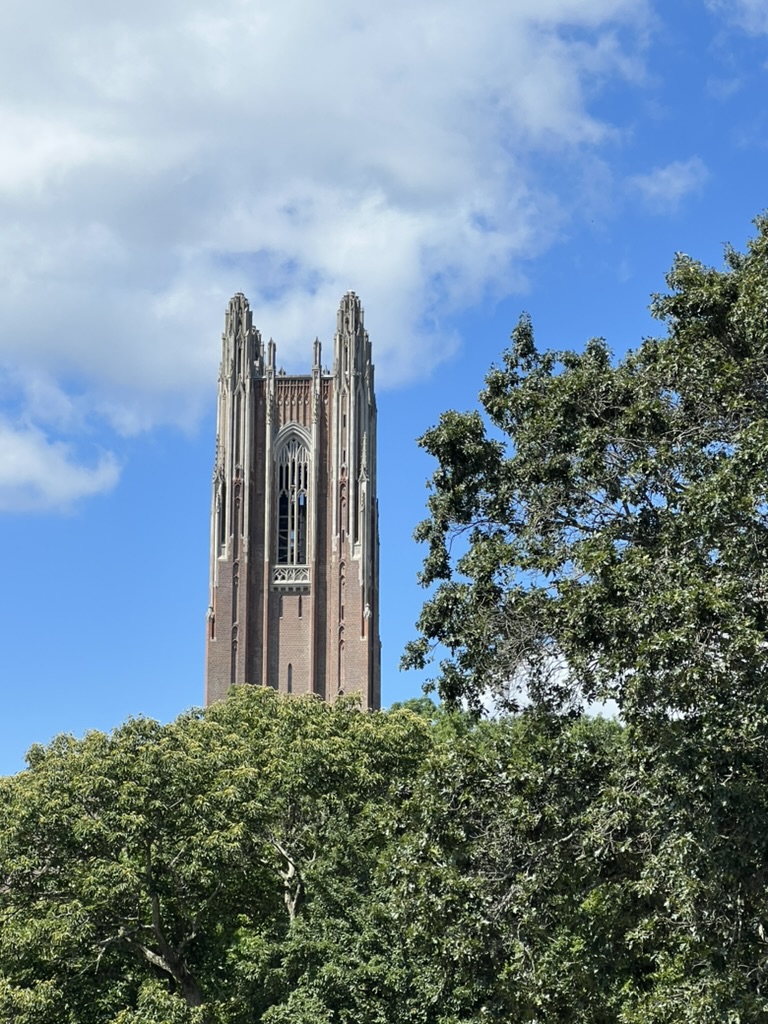
The most popular dorm among respondents was Tower, at 19.1%. This was followed by Stone Davis, at 17%. The least popular dorms were Shafer and Lake House, each at 2.1%.
When asked if they would pick Wellesley again, 55.9% said yes.
92.4% of seniors said they joined a campus organization at some point during their time at Wellesley. The most popular type of organization is a cultural organization and the least popular is a society.
It was more common for students to go to on campus rather than off campus parties. 8.3% of respondents said they went to parties very often, while 6.9% said they went to off campus parties very often.
41% of students said they were currently in a relationship.
36.5% of those in relationships said they had met their partner in-person at Wellesley. 31.1% said they used dating apps.
35% of respondents said they had 1 romantic/sexual partner while at Wellesley. 25% said they had 2-4, and 22.1% said they had no partners.
45.7% of respondents described their political views as “progressive,” while 44.3% described their views as “very progressive.”
85.7% of respondents said they “disapprove of all” of Trump’s policies. 8.1% said they “disapprove many of his policies, support some policies.” 2.2% of students responded “I don’t know” and 2.2% responded “I prefer not to answer.”
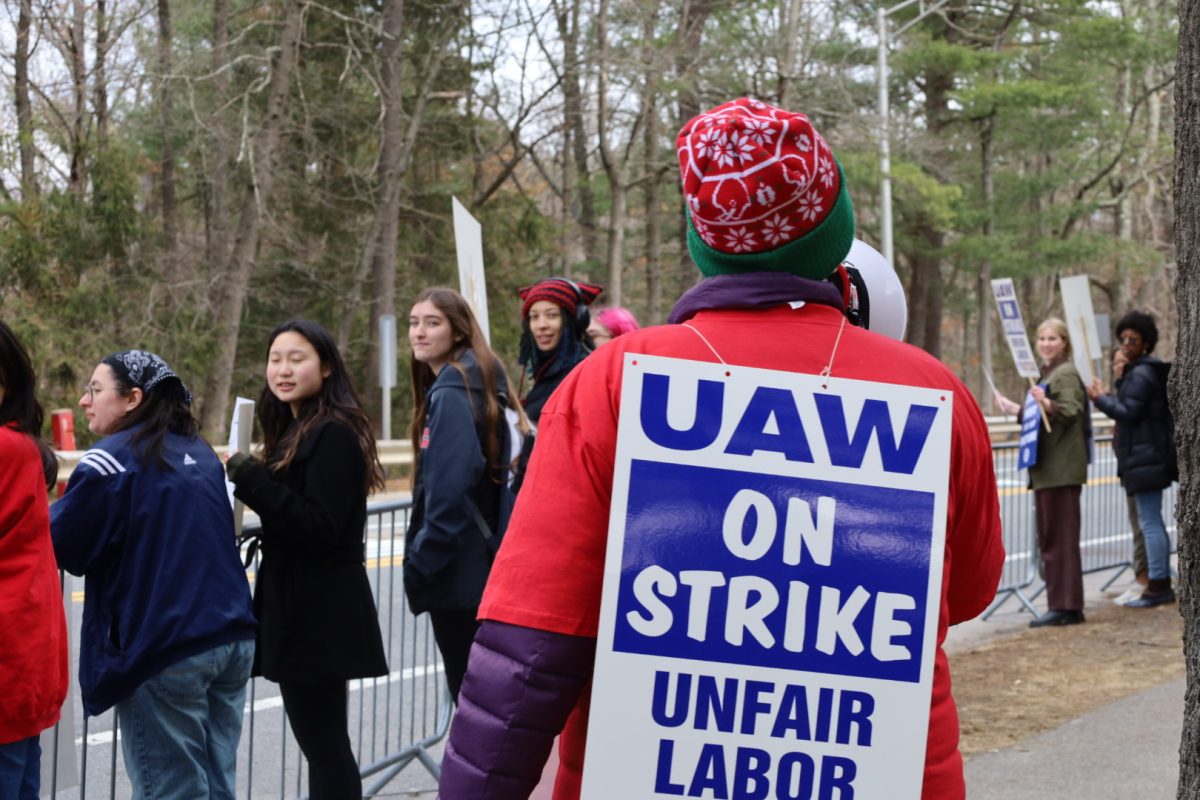
80% of respondents said they participated in protests during their time at Wellesley. Of those, the most common participation was in the WOAW strike, which happened this spring.